Leveraging Analytics to Increase Recovery: How Predictive Modeling Can Improve Secondary Market Profits for Your Business
B-Stock
Any worthwhile recommerce solution should be able to provide insights into the bidding behavior of secondary market buyers, allowing visibility into their purchasing trends and, thus, understanding the implications they have to the seller’s resale strategy.
But what is it about a particular listing that makes it valuable to buyers? What exactly is the difference between a lot that sparks a drawn-out bidding war and one that simply flops?
Even seasoned inventory management pros might guess that there are many factors that play into a listing’s value, some obvious and some incredibly subtle.
Looking at the question from a high level, value most often comes down to:
- Underlying retail price, essentially base MSRP
- Desirability of products, affected by characteristics such as:
- Category, e.g. apparel, consumer electronics, furniture, etc.
- Condition, e.g. brand new, opened-used, dented, salvage, etc.
- Brand, ranging from generics to premium designers and manufacturers
- Demand factors, including:
- Current supply
- Projected production levels
- Seasonality
The countless variables that comprise these three main classifications make it quite difficult to determine what will lead to a high final sale price, but there are patterns to recognize.
Measuring Auction Success
While a recommerce solution can be evaluated on many criteria—ease of use, features, cycle time, and so on—this discussion will focus on money. Specifically, the metric we’ll use here is recovery rate—the percentage of a given lot’s original MSRP that the client makes back through the secondary market.
Here, we’ll discuss a handful of ideas that sellers might want to experiment with while fine-tuning their reverse logistics operations and inventory reduction efforts.
Do Recovery Prices Really Matter?
In a word, yes. Sellers want high prices for the surplus items in their auction lots, in order to recover as much of their value as possible. Top recommerce solutions earn a percentage of this recovery, so they’re equally incentivized to max out their clients’ return on investment.
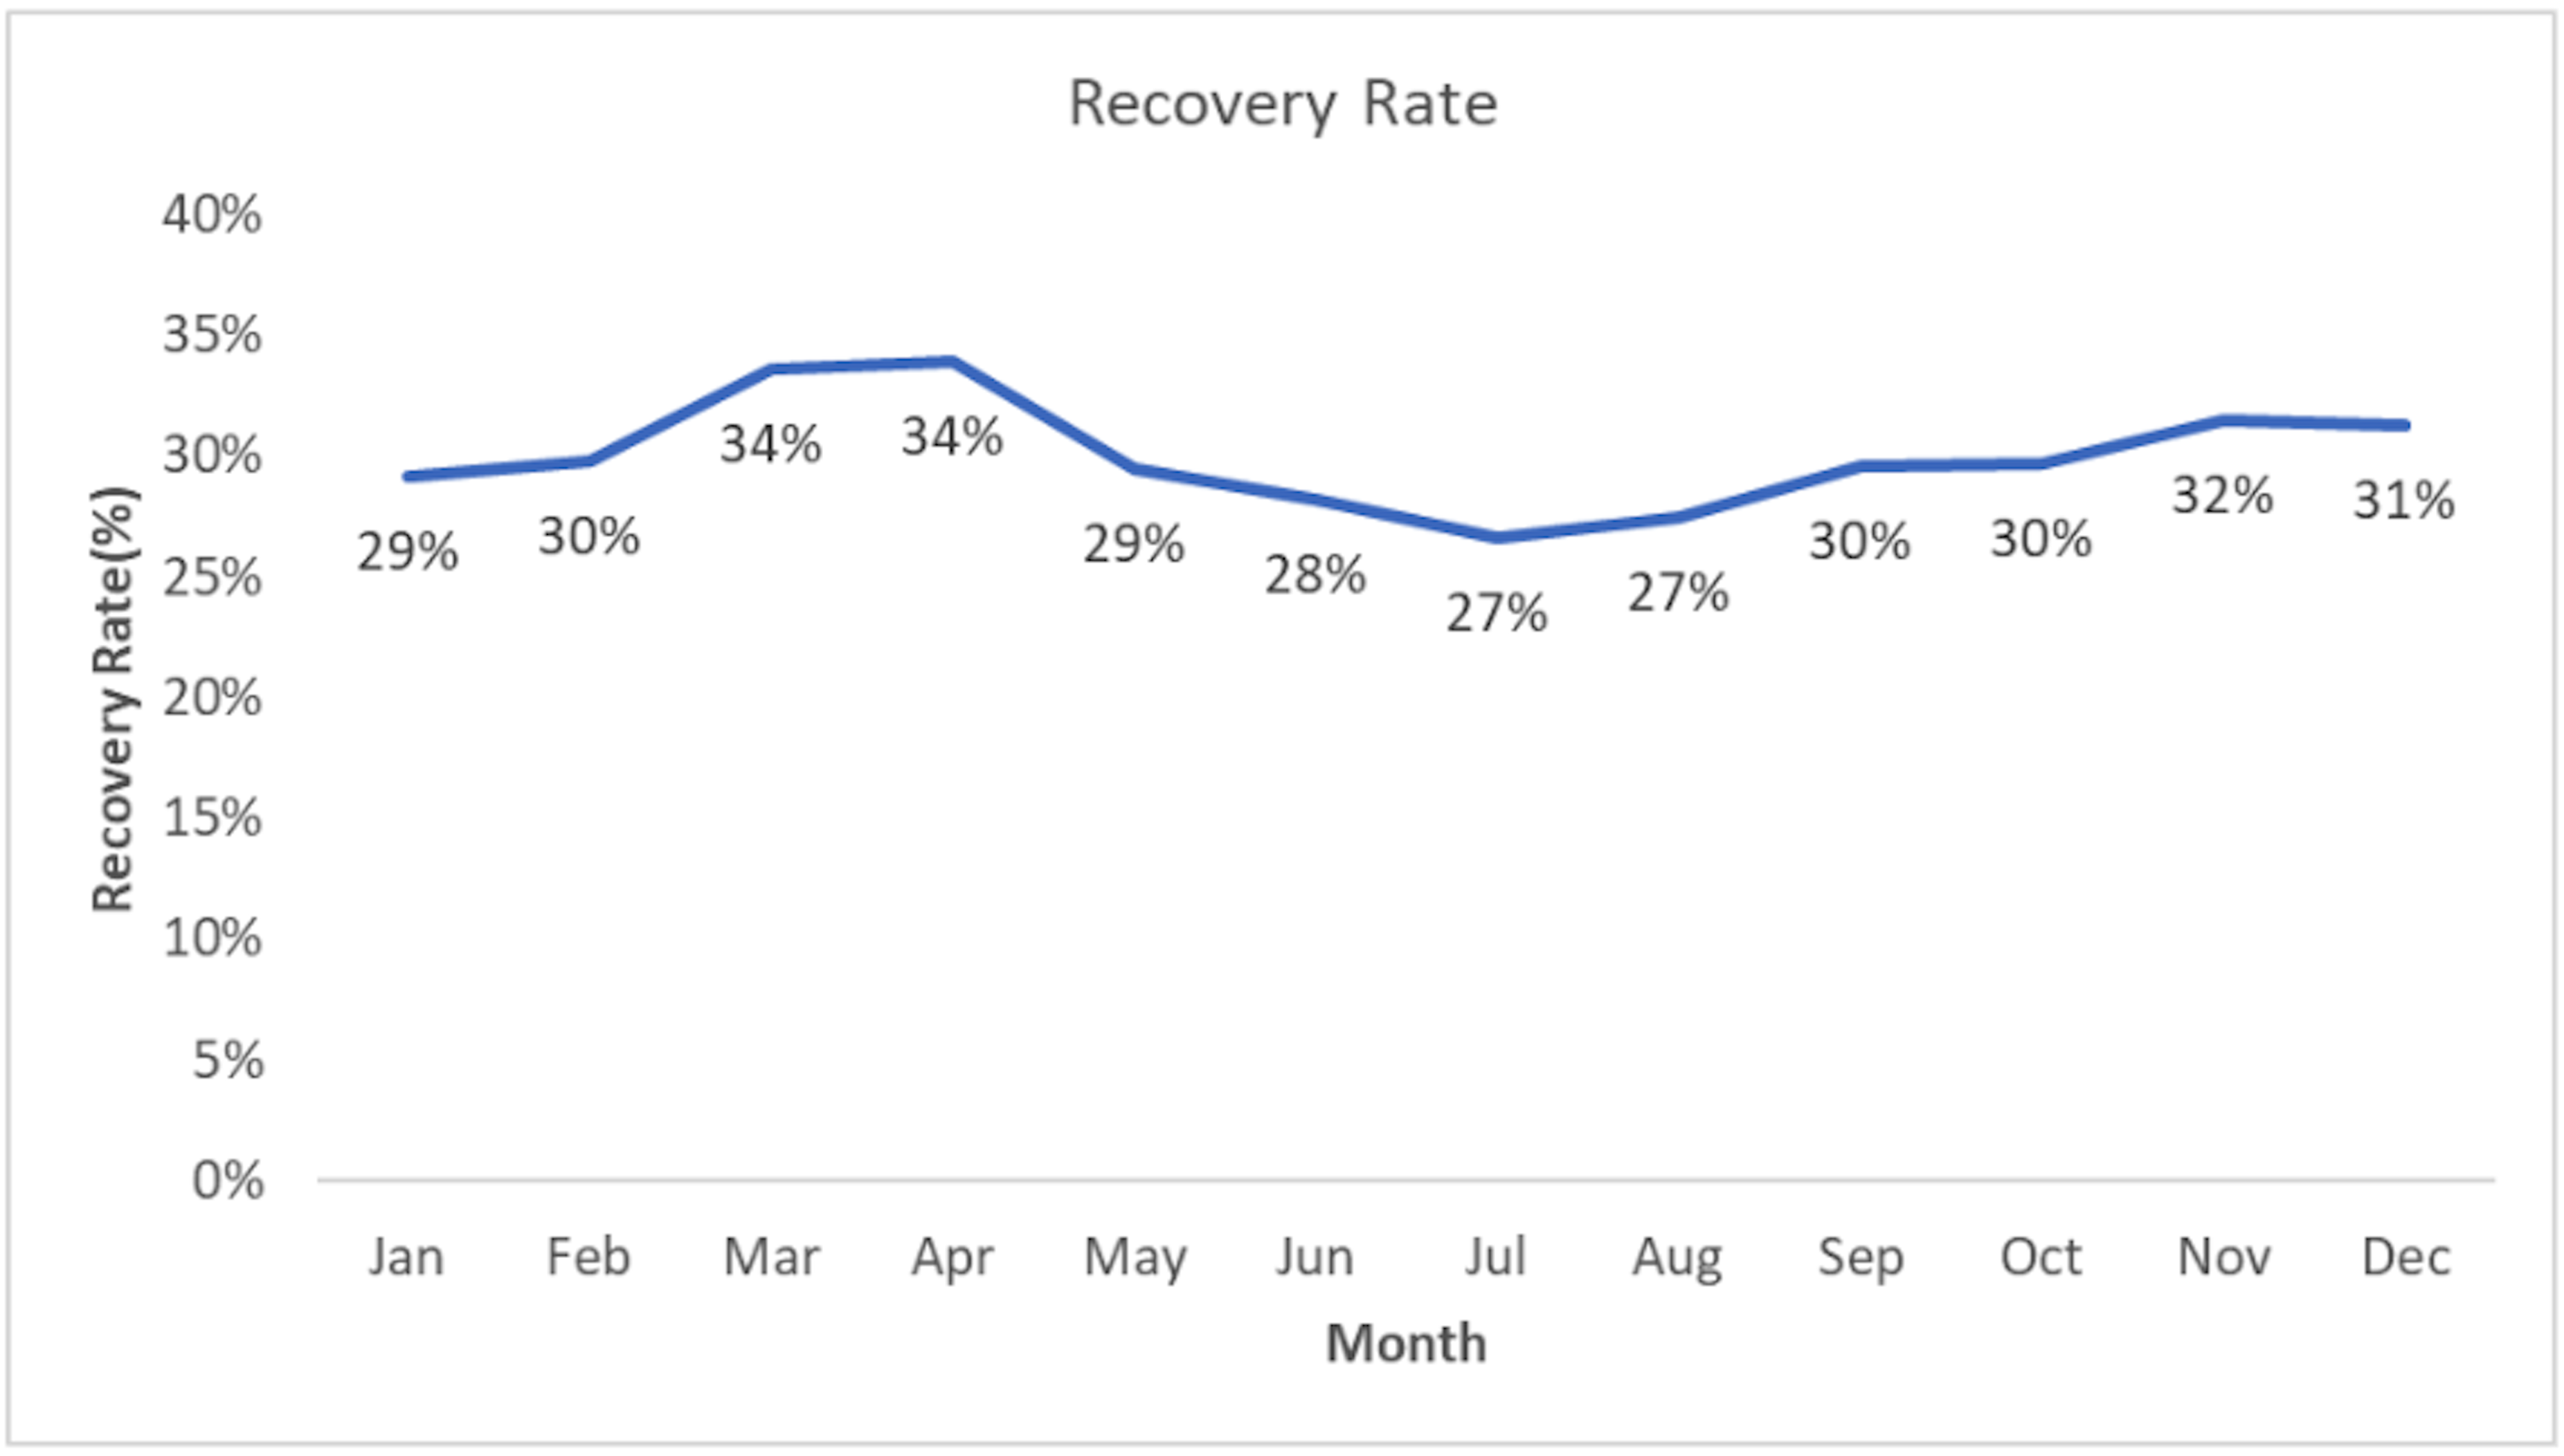
Fig. 1: Just a small dip or rise in a graph’s line can equate to millions of dollars.
This chart in Figure 1 illustrates the recovery fluctuations of a typical seller over the calendar year. Beginning at 29% in January, recovery peaks in the spring and bottoms out by midsummer. Although these highs and lows deviate less than 5% from the average, such variance can equate to millions of dollars captured or lost.
And throughout this period, inventory levels fluctuate, product desirability shifts, and seasons come and go. All of these concurrent variables make it very difficult to determine what factors truly affect recovery rate.
What Factors Drive Recovery Rates?
While there are hundreds to consider, we’ll focus on the five most prominent drivers of recovery rate.
- Category
The first, and perhaps most obvious variable to highlight, is product category. Recommerce solutions will generally assign every auction a high-level category, as it’s often the easiest way for a buyer to find relevant auctions.
Some examples of such categories might include:
- Apparel, Footwear & Accessories
- Furniture & Home Decor
- Groceries
- Office Supplies & Equipment
- Sports & Outdoors
Looking at recovery rate across many possible categories, even a casual observer will see there's quite a bit of variability. Top categories such as Computer Equipment & Software and Consumer Electronics, recover three to four times as much as mixed lots.
The first take-away from this insight is that sorting lots by category will earn back more cash value. This is a common recommendation that recommerce solutions make to sellers as it can increase recovery rate from 30-100% and, on unique occasions, even more.
Even within a specific category, there can be large variance in recovery rate. For example, handbags may significantly outperform other items within the same Apparel category.
- Brand
Beyond categories, expect certain brands to consistently have higher recovery rates than others. While this should come as no surprise, a broad body of data allows the best recommerce solutions to see certain top performers and where they lie in relation to others.
Even on the secondary market, well-known luxury brands commonly outperform house brands in the same category by ten or twenty times—and this phenomenon is certainly not limited to items in the apparel space. Take for example Computers, Equipment & Software. Here too, well-known brands handily outperform house brands. There’s even a clear hierarchy within the upmarket brands, with Apple commanding the highest prices by a considerable margin.
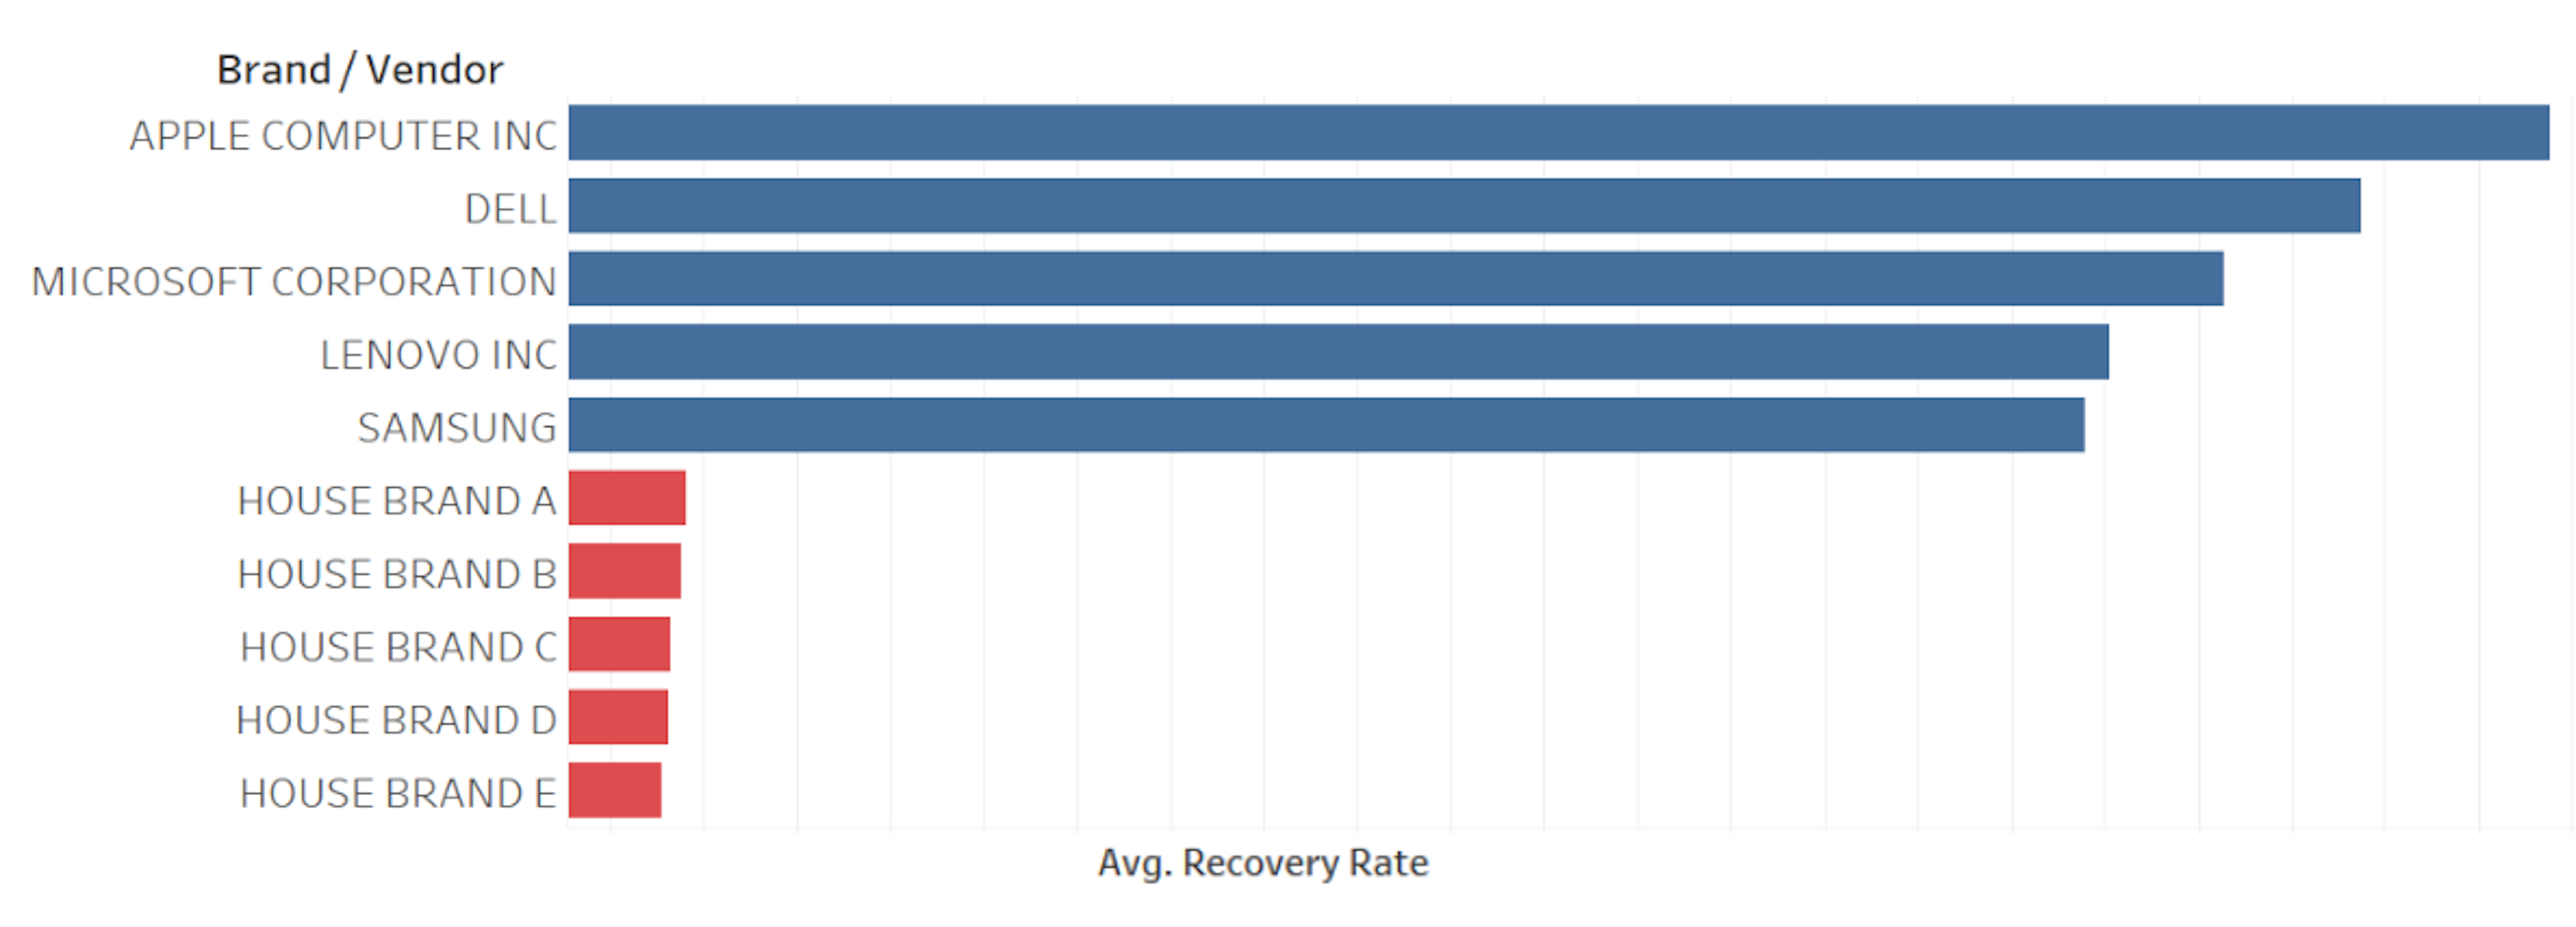
Fig. 2: Brands carry significant value to buyers in categories such as Computing & Consumer Electronics.
As with category sorting, grouping these high-value products together results in meaningful overall recovery gains for sellers.
- Condition
Recommerce solutions should provide a range of product conditions that sellers can choose from when listing their merchandise. Although returned and overstock products can go by a variety of names depending on the seller (and come in a variety of states and conditions—with tags, without tags, open box, non-original packaging, etc.) common designations might include:
- Brand new
- Like New
- Used - Fair
- Used - Good
- Scratch & Dent
- Salvage
The condition of the listed goods is yet another factor to consider when predicting a listing’s recovery rate. While this is unsurprising in itself, a closer analysis of sales patterns in a certain category can reveal unexpected phenomena.
For example, let’s say a seller notices their “Used - Fair” apparel items are outperforming better conditions. On the surface, this seems odd as “Brand New” and “Like New” items should command the highest prices. However, a deeper dive into the data reveals that this is because highly desirable designer handbags—a subcategory of apparel—are over-indexed at this condition level. The ability to identify and account for such anomalies is an enormous business benefit.
- Lotting & Listing Practices
Before listing goods for sale, sellers often need to submit a manifest—a list of goods—to help potential buyers make informed bids. How exactly a seller classifies these items to form their lots is a critical consideration when trying to maximize sale price and recovery rate. It’s also the first of the major value factors that sellers can actually control.
So what does it mean to have a well-designed lot? Consider these three listings:
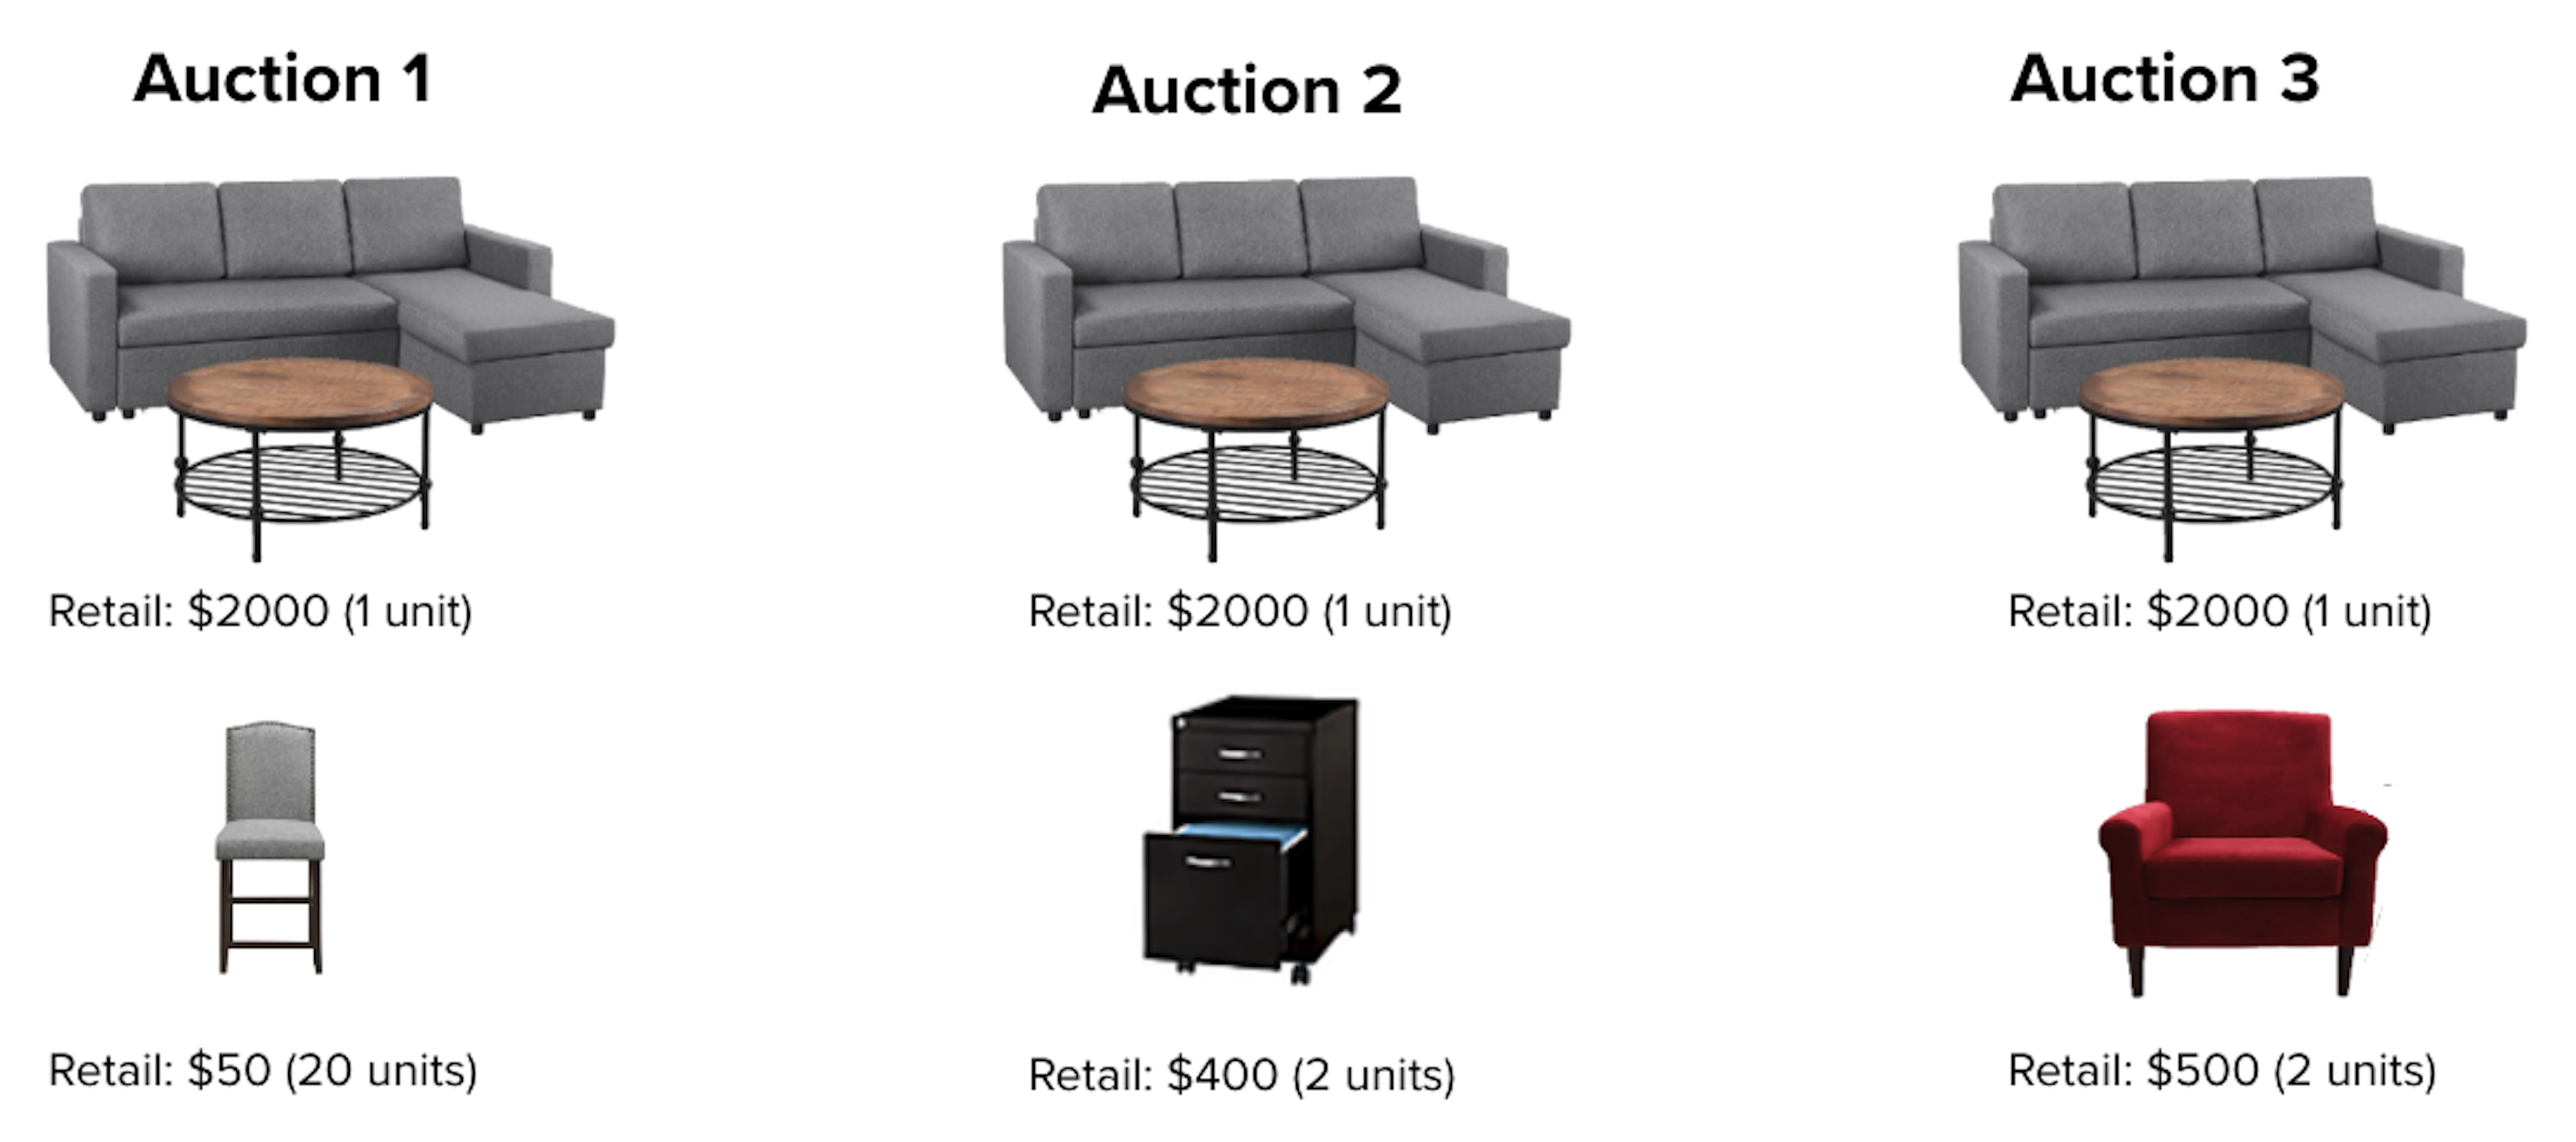
Fig. 3: Buyers’ actual preference between these three lots have surprised many sellers.
While these lots are all plausible combinations of merchandise with similar retail values, recommerce analysts have observed that Auction 3 will consistently outperform the others. But why? Essentially, it’s a matter of grouping similar things together.
Auction 1 offers a big-ticket item—a couch—alongside many inexpensive dining chairs. While both of these items are common in any apartment or house, they are too dissimilar in price and purpose. A small business might not want many low-margin products that can be purchased by customers as one-offs or in odd numbers, or perhaps they simply don’t have space to store 20 chairs. It's even more unlikely that a business looking for $1,000 worth of dining room chairs would want to buy a couch for an additional $2,000 just to get their preferred merchandise.
Auction 2 pairs the same couch, with two small filing cabinets—technically furniture, but completely different uses. These would be much harder for a home furnishing store to sell to its customer base. Such items might pair better with other office furniture such as conference tables, desks, coat racks, etc.
Auction 3—the couch and two plush armchairs—represents the best balance between item similarity and price parity. While certain buyers may be open to purchasing lots with items of disparate values and uses, it’s their prerogative to decide that, not the seller’s.
This example illustrates two key takeaways:
- First, lots with items of similar retail price tend to recover more value
- Second, lots containing items from fewer subcategories—ideally just one—recover more than varied lots. As the more subcategories that exist per lot, the higher the chance that a buyer won’t need every item. In this case, they will either bid less or skip the auction altogether
- SKU Depth
Another way to evaluate listings is by their SKU depth. Items in a given SKU will always be of the same category and subcategory. But for many types of products, there are multiple characteristics beyond subcategory that differentiate one item from the next.
Apparel is a good example of this. A “shallow” SKU lot can contain many different products, including shirts, pants, dresses, jackets, men’s and women’s clothes, and so on, all of various colors and sizes. The items in a “deep SKU” lot will be far more uniform. For example, a deep SKU listing can be as specific as “200 mens polyester blend dress shirts, blue, size large.”
But is any particular zone of the SKU depth continuum better for recovery than the other? Take a look at these three listings:
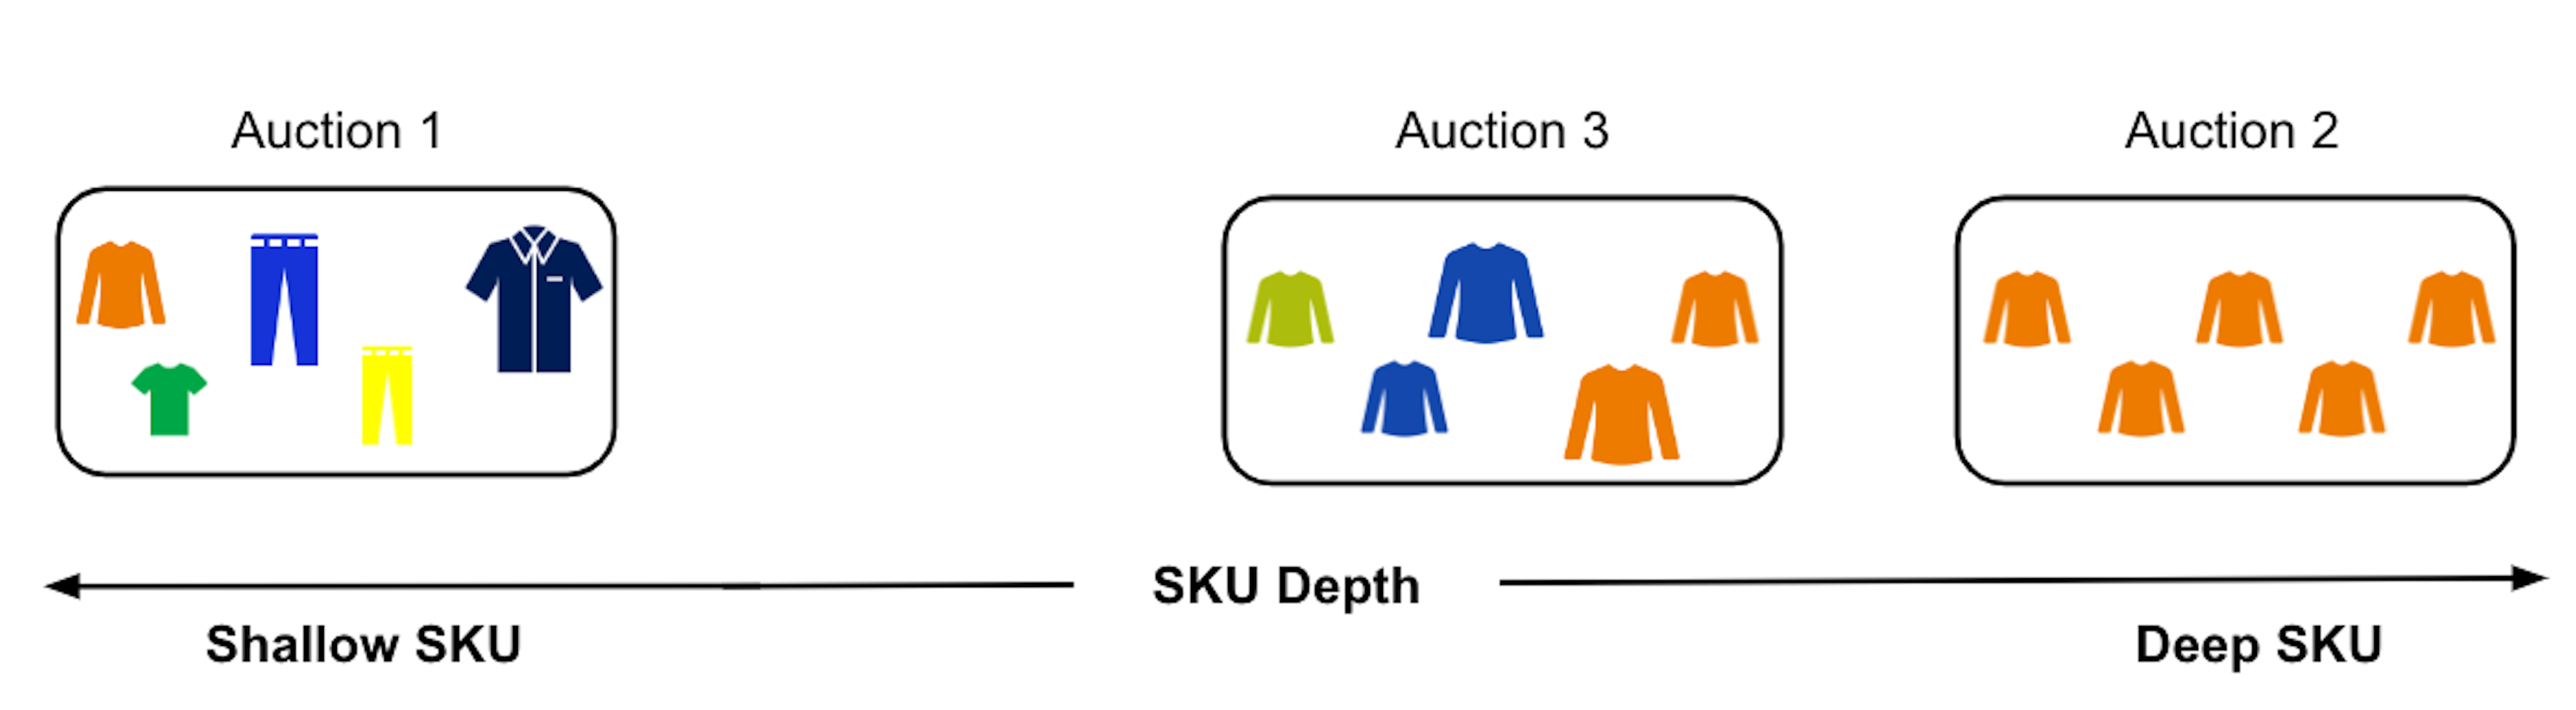
Fig. 4: As in Figure 3’s example, buyers’ preference between these sample lots may seem unintuitive.
In the factors we’ve examined so far, buyers seem to like specificity. So the reality might come as a surprise: Apparel buyers faced with a choice between these lots will regularly choose Auctions 1 and 3 over the very specific Auction 2.
But this pattern isn’t so consistent or straightforward for all categories. Take Luggage and Sporting goods, two types of merchandise that benefit from deeper SKUs:
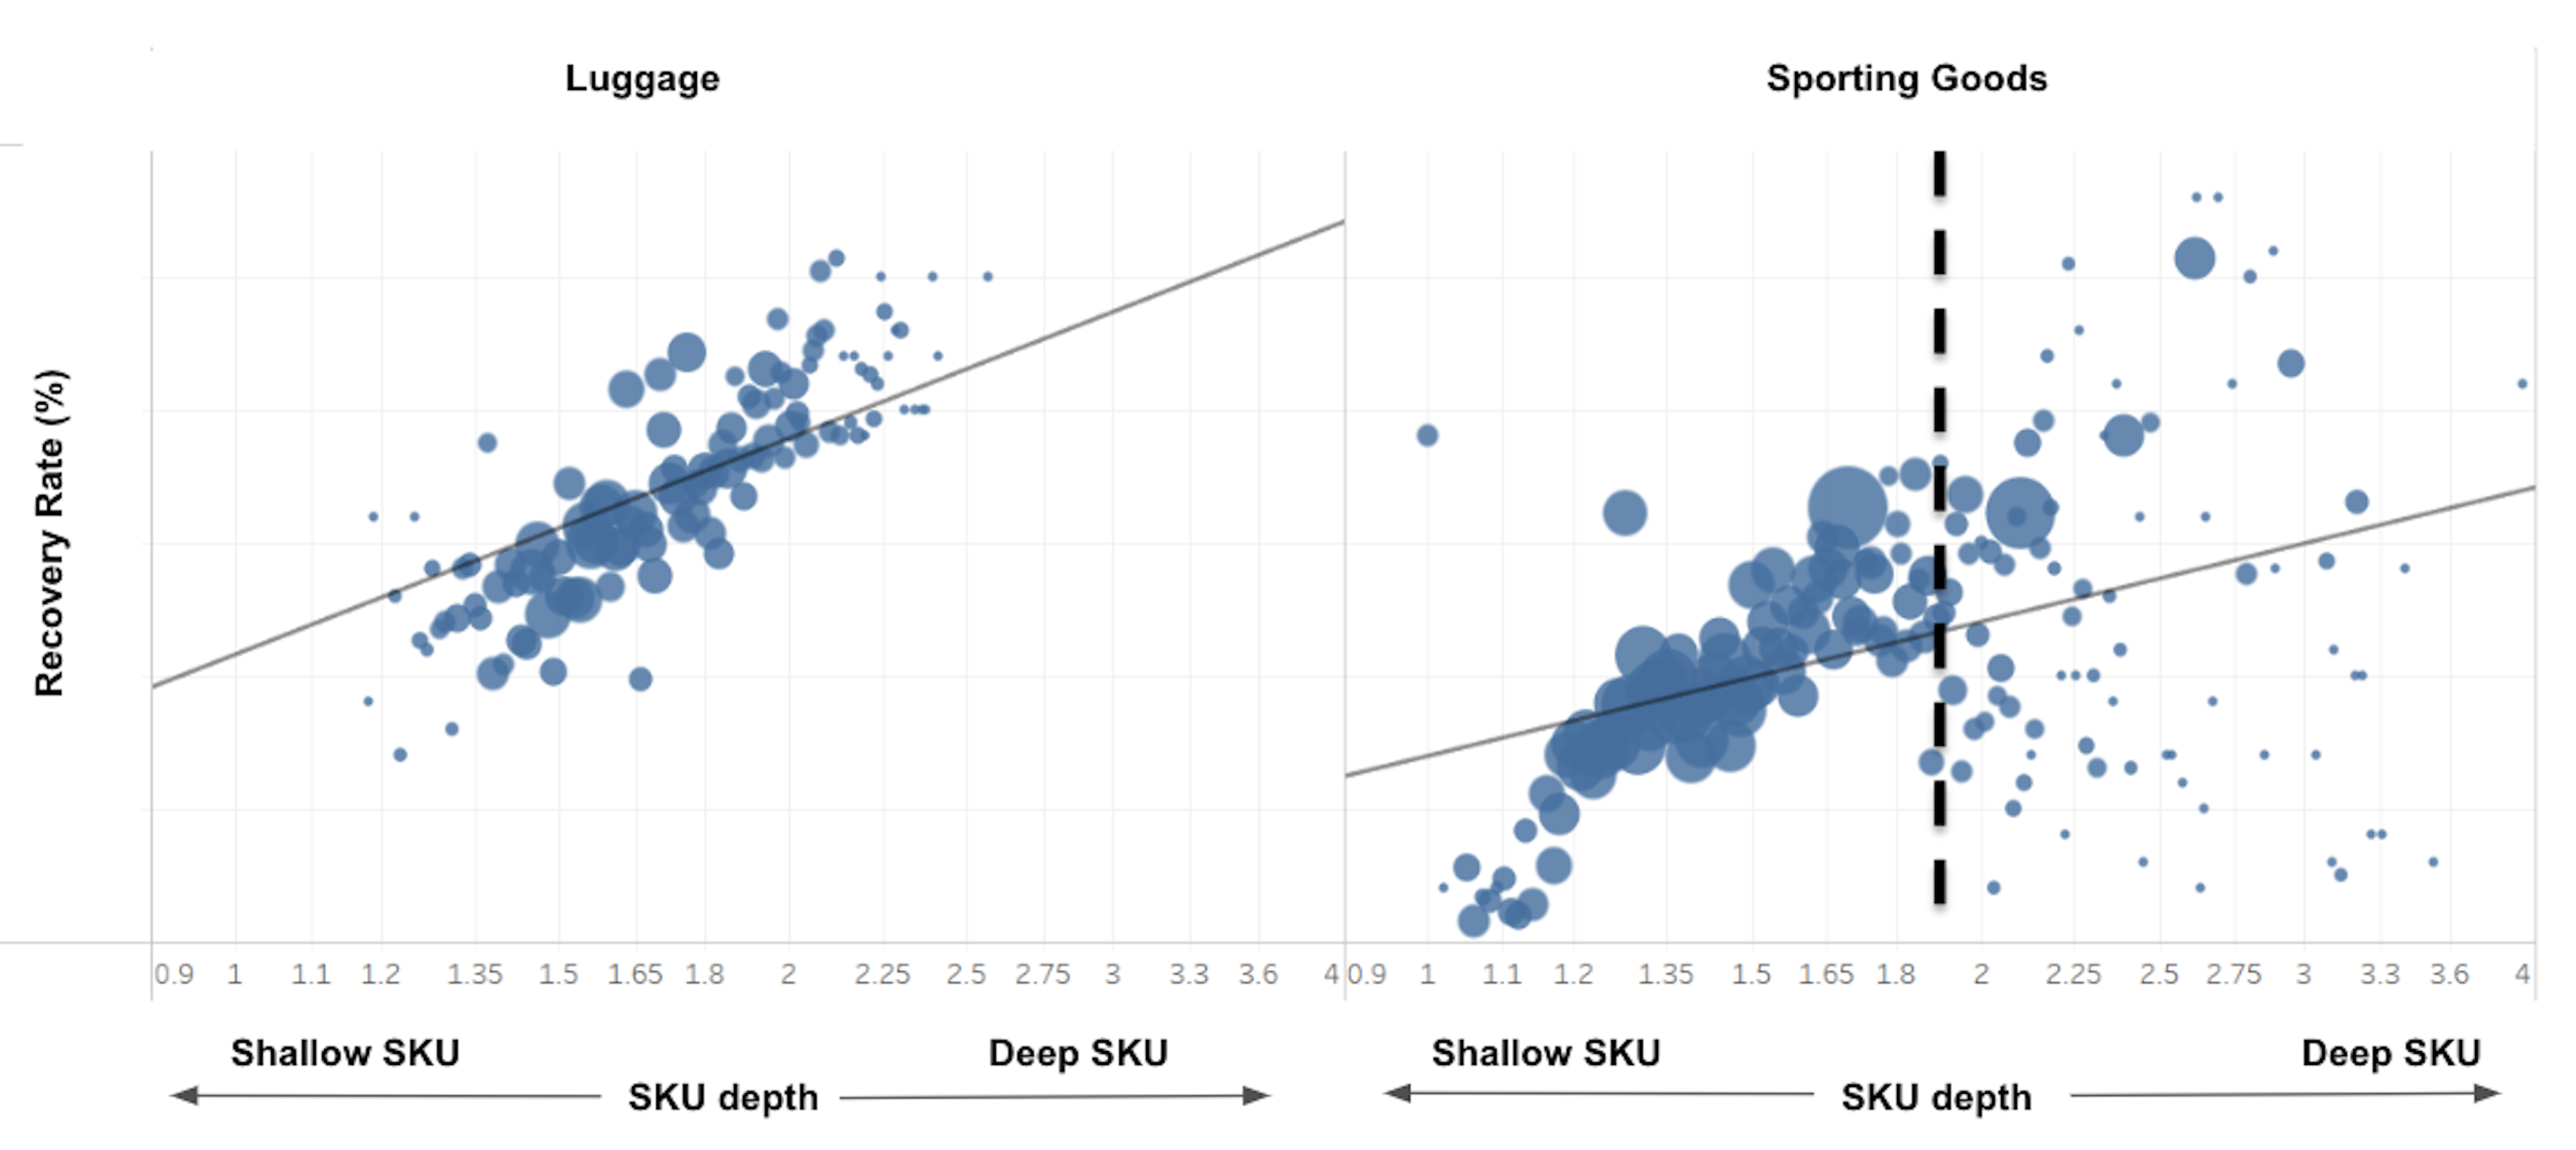
Fig. 5: Sometimes, recovery increases with SKU depth—but only up to a certain point
Further, you might find that SKU depth only affects recovery on some items up to a certain point (the dotted vertical line in Figure 5), after which many other variables obscure this correlation.
In the end, SKU depth will usually affect recovery rate in some way, but it’s not safe to make sweeping generalizations about the direction of this relationship without examining plenty of other data.
What to Keep in Mind Moving Forward
The insights outlined above can help your business no matter where you are with your recommerce strategy. In the early stages, you can watch the three foundational factors—category, brand, and condition—to better forecast your recovery and plan your resale tactics accordingly. Once you’re up and running, you should look to take control of flexible factors like manifest design and SKU depth to extract even more value from your surplus goods.
Here are a few important takeaways for both new and seasoned sellers:
- Be particular and precise. Always provide images, listing titles, and manifest data that are as descriptive and detailed as practically possible. Buyers appreciate transparency, and even if the auction isn’t lotted to their ideal specifications, everyone likes to know exactly what they’re getting.
- Trust in expert guidance. The best practices and recommendations of the most capable fully managed recommerce solutions will be backed by years of proprietary network-wide data—that means hundreds of thousands of auctions for goods of all categories, conditions, quantities, and locations.
- Always challenge the status quo. Stay vigilant for ways to refine your reverse logistics strategies internally, tweak your resale process, experiment to discover new approaches, and balance resource spend with value recovery in a way that benefits your bottom line.
B-Stock Leads the Way in Recommerce Analytics
Even the world’s top brands and major retailers struggle to manage vast amounts of returned or unsold goods that congest warehouses and tie up cash value. This universal challenge is why B-Stock has spent years gathering valuable data insights to develop an analytical model that accurately predicts the recovery rate of any given lot based on known variables.
In fact, the insights throughout this article are the fruit of this successful effort. Built on data from over 100,000 auctions and more than 100 unique variables, our predictive model is currently delivering significant financial results for our clients, and we’re continually refining it. With B-Stock’s cutting-edge analytics capabilities, businesses like yours no longer need to write off the value locked-away in excess inventory as the cost of doing business.
Want the full story of B-Stock’s predictive modeling initiative? Read our eBook Leveraging Analytics to Increase Profitability.
Ready to talk now? To learn what B-Stock can do for your business, reach out to us today.

B-Stock is the world’s largest B2B recommerce marketplace. Billions of dollars in returned and overstock inventory are resold through B-Stock each year as a result of unparalleled buyer demand, streamlined operational processes, and extensive expertise and insights.Industry leading brands and retailers trust B-Stock with their recommerce operations because we deliver superior financial results and significant improvements in velocity and efficiency, all while furthering global sustainability efforts.