Linking the Returns Process to Customer Loyalty
By Tim Brindley, Vikas Argod, NTT DATA Services
Return processes have various options that are often determined by designing to cost, with limited or no data related to customer loyalty involved. The design decisions pertaining to return preparation, return collection or drop-off, and refund can all have unintended negative consequences or positive influences on a return experience that will help drive customer loyalty.
In this article, we provide a metrics-driven framework and directional data to supply chain leaders that will help design a returns process that drives value. Unsurprisingly, a frictionless returns process and a fast refund can generate repurchase rates as high as 30% to 40%.
The returns experience is a key element for customer loyalty
The returns experience, especially in a Direct-To-Consumer (DTC) channel, is crucial to the entire customer experience. A good experience is essential in motivating customers to shop again and thus creates stronger loyalty. Yes, these statements are as controversial as a free slice of pizza. However, in case you don’t like pizza:
- Over 80% of customers read returns policies (e.g., processes and rules) before making a purchase, and 44% of those will look for an alternate product or retailer if they dislike what they see[1]
- 84% customers said a positive returns experience encourages them to shop with a retailer again[2]
Overall, customers form their opinions on their return experience based on three questions:
- How hard was it to prepare (initiating-to-packing) the return?
- Where was the drop-off location or pickup point? Was it conveniently located?
- How soon was the refund issued?
“Repurchase Rate” as an indicator of customer loyalty
While the immediate expression of the experience is mostly via social media posts, emails, chats, or calls, we believe the strongest indicator is “repurchasing within 120 days of a return.” The number of days might be different for each industry segment and product profile (you can’t treat purchasing a T-shirt the same as purchasing a diamond), but the repurchasing rate says a lot about the experience. Mass surveys or customer satisfaction scores also give data around returns experience, but it is hard to adjust for response falsification or the “only-angry-customers-provide-ratings” phenomenon. We use this metric to evaluate various supply chain design decisions in relation to the three aforementioned questions driving the customer experience.
The repurchasing rate is calculated as the share of return customers that purchase on a website within a certain number of days. We have used 120 days as a baseline number for this article. Repurchasing rates vary from 5% to 50%. For a $100 million business with a 20% return rate, repurchase revenue can represent as much as 10% of total revenue, which is a sizable portion that awaits the focus it deserves.
A note on the data used throughout this article: It relies on each author’s multiple years of DTC reverse logistics experience working with clients in apparel, electronics, footwear, telecom, home improvement, and health & wellness amounting to $50+ billion in DTC sales in the US. We have excluded big & bulky item return data due to its specialized nature.
The less friction in return preparation, the better
There are five broad categories of combinations of initiation, labeling, and packing options. Offering seamless exchanges also belongs in this category, but it was hard to find an independent impact on the findings due to the nature of the data. The definitions and repurchase rates are given in Exhibit 1.
Exhibit 1: Returns preparation categories and repurchase rates
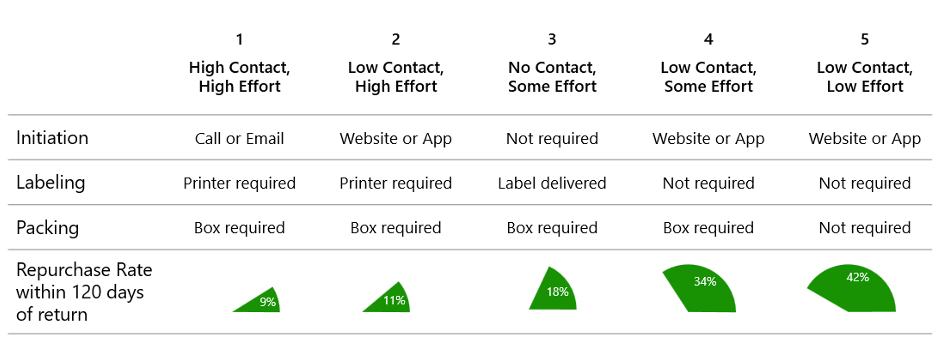
The more time spent setting up a return inevitably results in a reduction in customer repurchasing within that 120-day window. Initiation has evolved to where human contact is rarely required in DTC, but the biggest shift is occurring on the labeling and boxing side. While there is a gradual increase in customer loyalty with the simplification of the process, the biggest percentage increase (16 percentage points) is observed when no printer is required. Adding box-less returns is even better (an 8 percentage points increase). The option of including a return label in the outbound box has mixed results, since customers misplace the labels and must then contact customer service to get a shipping label and print it themselves (Options 1 or 2 in Exhibit 1).
To put this in perspective, for a $100 million business with a 20% industry average returns rate, deploying “Low Contact, Low Effort” (Option 5 in Exhibit 1) can result in $7 million more revenue compared to “High Contact, High Effort” (Option 1 in Exhibit 1). In the parlance of our North Star, it is “pretty, pretty, pretty good.”
Customers want returns to be a walk, not a marathon
Unsurprisingly, customers with less than 15 minutes of travel time to a drop-off location had repurchase rates around 40%, while the same metric hovers below 20% among customers living farther away. No difference in returns percentage was observed across the customer base. A drop-off location can be the brand’s retail stores, drop-off boxes, parcel carrier locations (UPS, FedEx, USPS), and parcel carrier partnerships (e.g., Happy Returns, Walgreens, Michaels).
Exhibit 2: Distance to drop-off and repurchase rates
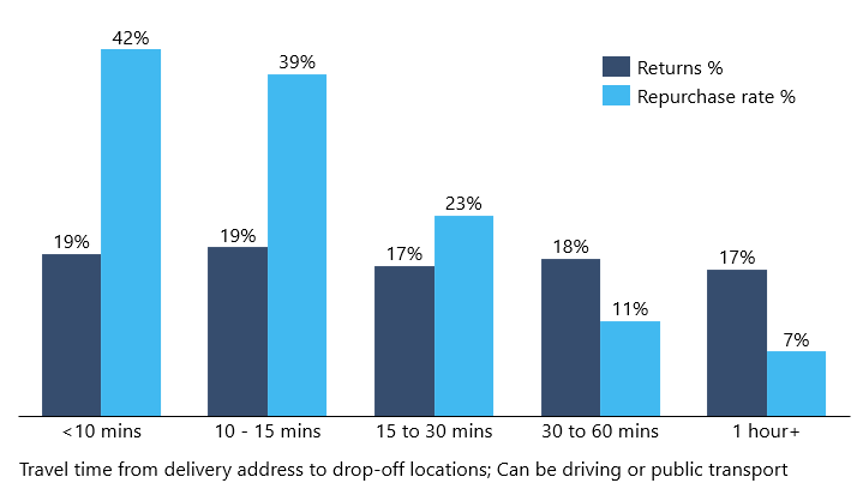
Exhibit 2 represents an obvious case for partnering with multiple providers to reduce the distance for customers. The right selection of carriers depends on every brand’s customer geographical distribution. These results should be examined along with the ease of a printer-less return process. That means QR-enabled scanning becomes a critical requirement for service provider selection. Having a drop-off location nearby is beneficial, while ensuring printer-less returns at these locations enhances the customer experience.
In Japan and Korea, returning to convenience stores is gaining popularity. Due to their high density in metro areas, they also act as a pickup option for customers. It is easy to see the popularity of this option; however, except for a few metropolitan areas in the US, we do not see this becoming a major disruptor anytime soon due to the absence of such locations. The same applies to lockbox returns. To be successful, these options need to build a considerable network, which can lead to a “chicken-or-egg” situation.
Home pickup is good, but upfront scheduling is a must
While home pickup of returns is the default choice in China, India, Japan, and other Asian countries, this is not common in the US (except for Big and Bulky returns). As customers continue to become more comfortable remaining in the confines of their homes, companies like DoorDash are capitalizing on their current infrastructure to perform the e-comm returns version of backhauls for a flat fee of $5 ($3 for DashPash members). Rolled out during the returns apex, the first week of January 2023, this is a new trend in returns processing. What makes DoorDash’s entry in the market particularly appealing is the fact that brands can leverage customers’ familiarity with DoorDash’s existing technology platform, receiving real-time updates on when to expect their Dasher to arrive for pickup.
Since home pickup by DoorDash (or similar companies) is a recent phenomenon, outcome data is still raw, with limited ability to draw conclusions. Carriers like UPS and FedEx have always had this option, but adoption was between 2 to 5% since it is mostly charged to customers ($5 to $10 per pickup, on average). The other option is placing the return package inside the mailbox for the USPS mail carrier to pick up. The USPS option is limited to products that can be fit in the mailbox and has mixed reviews from customers and brands. Printing of shipping labels, lack of tracking, or problematic product dimensions are some reasons behind these mixed reviews.
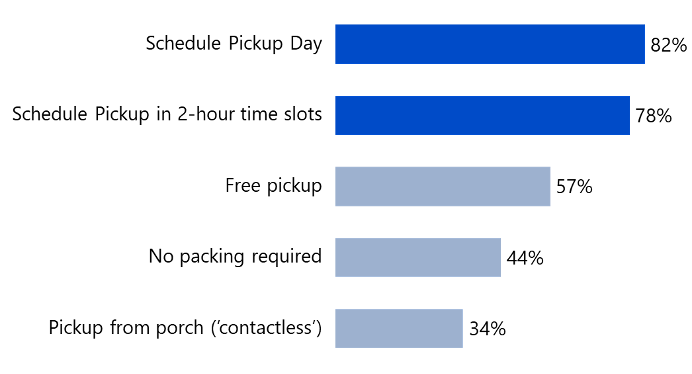
When it comes to home pickup, customers value certain aspects such as free pickup and schedule adherence much more than perceived convenience. Since it can be an expensive option to roll out from the supply chain leaders’ perspective, it is important to recognize the “voice of the customer.” Exhibit 3 provides a ranked list of customer preferences that can be used to evaluate service offerings or design options.
Exhibit 3: Customer ranking for home pickup of returns
Refunds at the speed of light (or within three days with visibility)
If there is a single metric that determines customer satisfaction, it is time-to-refund. From the time of drop-off or pickup, how many days are customers waiting to get the notification that a refund has been issued? We exclude bank processing times (generally 2 to 4 days) for now. With the advent of digital wallets, even these processing times can be shortened, creating additional customer stickiness. Customers want to know that their money is safe. Every brand decides on certain criteria to issue refunds, which can be as simple as “when the customer drops off at a location” or “once processed at the returns center.” Exhibit 4 provides average refund times. As expected, the longer the refund time, the more unhappy customers are.
Exhibit 4: Average refund times (excluding bank processing times)
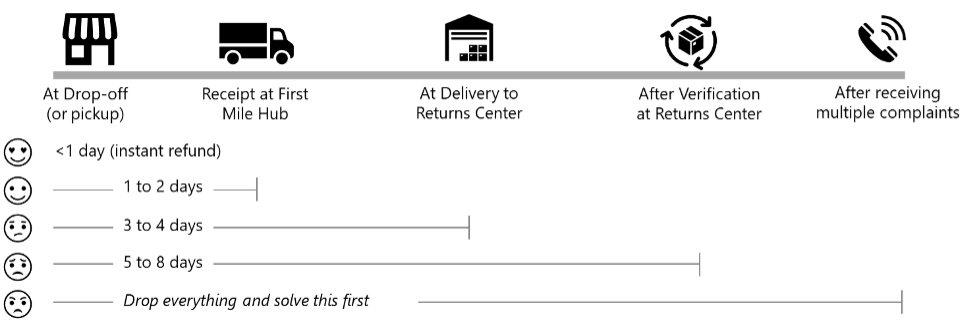
Besides refund times, visibility of the process is equally important to customers, especially when the refunds are 1+ days out. Keeping customers informed about each step of the process and the approximate time to refund is critical. Repurchase rates drop by 60% when refund times are three or more days and visibility of the process is poor. Sending notifications (or providing the simple ability to check the process on an app or website) are appreciated by all customers. These differences can amount to $5 to $6 million in repurchase revenue for a $100 million business with a 20% return rate.
Exhibit 5: Repurchase rates for instant refund vs. other options

Developing customer focus on sustainability aspects
Sustainability, and the importance of embedding sustainability efforts into the culture and supply chain practices of a company, is self-evident. Measuring the impact of those efforts in consumer repurchasing power, however, is not as clear. On the forward logistics side, trade-offs are required. As a consumer, do you want fewer packages? If so, you must reconcile that with a slower delivery speed. Once a return is generated, the reduction in friction (remember: no labels, happier customer) also holds true with a customer not having to mess around with corrugated boxes to ship back their product. In fact, third parties are helping champion the cause through box-free returns. All returns funnel through participating locations, which are then consolidated into one environmentally friendly container back to the returns center. So through highly sustainable efforts, we are also focusing on the trusted tenets (no labels and no boxes) that lead to a higher percentage of repurchasing by our customers, which translates into more revenue (Exhibit 1). Who says you can’t have it all?
One final thought on returns as they pertain to sustainability: the most sustainable return is the one that doesn’t occur at all. Winston Churchill once described certain geopolitical issues as a “riddle, wrapped in a mystery, inside an enigma.” The intent here is not to describe sustainability in obtuse terms. However, through a greater emphasis on collecting and analyzing data – and a little foreshadowing – you can understand what products are prone to damage in transit and use that data to correct the packaging issues that led to the return in the first place.

Collecting and analyzing customer-centric data
It’s clear that tracking returns data at a customer level is much more important than simply at a SKU level. Historically, customer-specific data was mainly used to issue a refund and the supply chain’s focus was mainly on making sure returns are processed and dispositioned. Also, looking at a customer’s returns behavior was mainly a fraud prevention tool and not a returns performance indicator. It is time to include new ways of evaluating returns performance. While we have given macro performances spanning multiple industries, it is important that each brand runs its own analysis and experiments. The ability to run Randomized Control Trials (RCTs) or even simple A/B testing on different returns optionalities will go a long way to optimize the returns experience. With the constant addition of new technologies, partners, and service offerings, tracking the data over time helps evaluate the need for change. It also helps to quantify the benefits of building a business case for that change. Incidentally, revenue increases are also a great way to get attention from the C-suite.
Nothing is certain except death, taxes, and... returns?
I don’t think Ben Franklin had this in mind when he spoke about life and the Constitution, but as DTC continues to grow, so too will the number of returns made by consumers. With that in mind, another great way to improve the customer experience is to enable customers with as much information as possible to minimize returns in the first place. It involves tracking the reasons for returns closely and taking corrective or enabling actions. We understand that. However, the reality is that returns are here to stay in the DTC business. So, while actions to minimize returns should continue, investing in ensuring frictionless returns is equally important.
[1] https://www.freightwaves.com/news/e-commerce-returns-give-the-customers-what-they-want
[2] https://www.prnewswire.com/news-releases/returns-experience-critical-to-customer-satisfaction-and-retention-doddle-survey-finds-301085222.html
 Tim Brindley, Vikas Argod
Tim Brindley
Vice President, Supply Chain Operations,
NTT Data / Chainalytics
Tim is a Vice President in the Supply Chain Operations practice at Chainalytics, with over 22 years of experience working in the industry and as a consultant in both the public and private sectors. Within his current role, Tim is responsible for designing and implementing operational solutions, particularly in warehousing, distribution, and manufacturing space across all major industry verticals.
Prior to Chainalytics, Tim worked at “K” Line America within their National Transportation Group, a 24/7 operation dedicated to the inbound and outbound flow of containers to key customers, including those in the automotive industry. Next, he spent 12 years at Booz Allen Hamilton, supporting the US Navy, Defense Logistics Agency, and NASA designing standardized and repeatable supply chain solutions for mission-critical systems. Finally, he spent two years at a large distributor within Oil & Gas developing and leading materials management solutions for Energy Companies.
Tim holds a Bachelor of Science in Marine Transportation from the United States Merchant Marine Academy.
Vikas Argod
Principal, Supply Chain Operations,
NTT Data / Chainalytics
Vikas is a Principal in the Supply Chain Operations competency at Chainalytics. He has over 12 years of supply chain consulting experience in warehouse design, logistics performance frameworks, distribution strategy, omnichannel optimization, store operations, and service delivery operations. He has worked in varied industries, including apparel & footwear, luxury retail, food manufacturing & distribution, automotive manufacturing and distribution, pharmaceuticals, and telecom.
Before joining Chainalytics, Vikas worked at SCA Technologies as Senior Analyst. He primarily focused on commodity sourcing optimization, distribution network design, and pricing analysis projects for one of North America’s largest Quick-Service Restaurant chains. Earlier, he worked as an engineer at the Final Assembly Plant of Tata Motors, an automobile manufacturer in Pune, India.
Vikas holds a Master of Science degree from Penn State with a focus on Operational Research and a minor in High-Performance Computing. He earned a Bachelor of Engineering degree in Mechanical Engineering from the National Institute of Technology Karnataka, India. He also holds a Graduate Certificate in Public Policy.