Finance Is From Mars, And Reverse Logistics Is From Venus - “How we can talk to each other”
By Reverse Logistics Association Consumer Products Committee , Reverse Logistics Association
Most companies focus on the drive to increase revenue. The battles to lower department budgets or to eliminate “unnecessary” costs can be a struggle. Hidden costs in areas such as Reverse Logistics can be missed because the managers in Finance and the managers in Reverse Logistics Operations do not speak in the same language.
The lack of collaboration between Finance and Reverse Logistics (RL) in many companies is preventing easy improvements to the bottom line. If we can learn each other’s language the savings impact is tremendous. By finding the passion to work across divisions, managers in these areas can improve a company’s bottom line by reducing returns, increasing asset recovery, putting in proper controls, and evangelizing best practices within the industry. “The first year Philips took a serious look at returns resulted in savings of over $40 million dollars, and Finance became best friends with Returns” says Tony Sciarrotta, formerly of Philips Consumer Lifestyle and currently Executive Director of the Reverse Logistics Association.
Finance is the land of black and white numbers. The value add of RL Operations can be difficult to measure and report. However, as long as Finance drives the numbers, and RL Operations are unable to quantify their value add, Finance will win. “A Returns Operations manager should have a finance manager as a best friend,” according to the current Director of Customer Care, Philips Consumer Lifestyle. Finance managers often have career goals to run some operations within their companies, and they should have a best friend who is successful in Reverse Logistics. Reverse logistics and asset recovery may be the largest source of savings inside most companies. Companies without a true returns management group that operates independently of sales, marketing, or finance/credit, usually do not have controls in place to reduce the reverse flow of products from the market, or to sell the returned goods into the right channels for a profit. RL Operations managers that can slow the flow of returns, and show reasonable recovery of cost on returned goods, can often deliver more to a company’s bottom line than sales increases.
FINANCIAL TOOL KIT FOR REVERSE LOGISTICS
“The right tool for the right job” – how many times has that been said, in so many situations. For Reverse Logistics, there are many tools to offer both sides of the aisle that can help. There are many approaches to reducing costs on the planet of reverse logistics. Finance and Returns managers have options today that were not available until recently. Finance and Returns managers can work together to calculate the impact of Reverse Logistics initiatives and offer a Return on Investment (ROI) proposal to senior management.
The Return Savings Calculator1 is an Excel file of a customized calculator for all RLA community members to download and use. The file is available through the Reverse Logistics Association website (rla.org/product/1284) and is a simple but detailed spreadsheet with terms and formulas developed by Finance and Returns managers working together.
The Returns Savings Calculator allows for any manager to insert specifics about sales volumes and return rates for a given product or category. The returns manager can then insert per unit costs for refurbishing, handling, warehousing, freight, and resale value. These numbers should come from a finance manager before ever going in front of senior management. The spreadsheet then allows for the cost of any returns reduction initiatives to be added on a per unit basis, and automatically calculate estimated savings to a company for implementation.
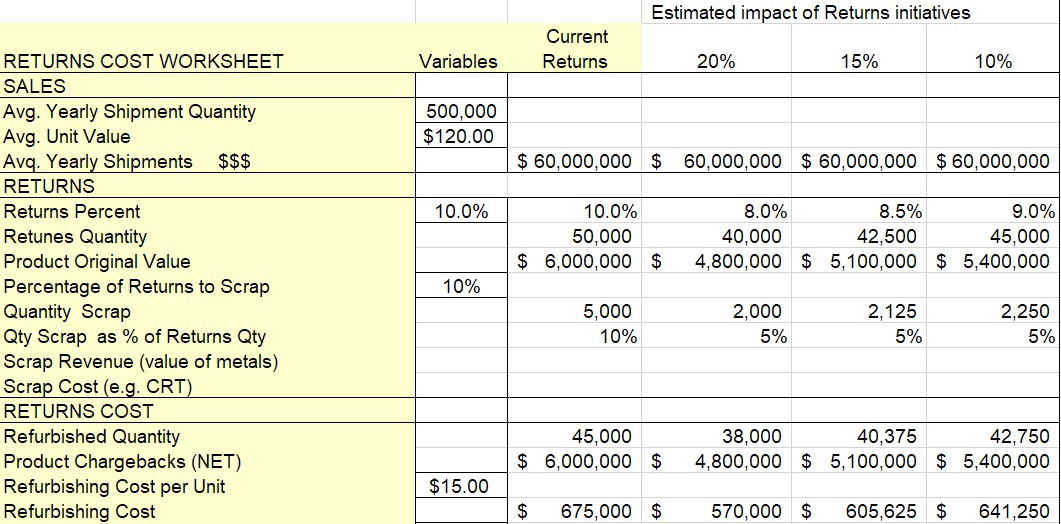
fig 1. Returns Savings Calculator preview
TERMINOLOGY FOR BOTH FINANCE AND RL MANAGERS
Even with the right tools to do the job, sometimes the terminology used, or misused, often derails otherwise successful communication. Obviously across industries, companies and even individual groups within organizations, definitions will vary slightly, however alignment between operations and finance on how standard financial metrics are gathered and reported must be clear to avoid pitfalls. Furthermore, continuity of operating terminology between sales/marketing and reverse operations can have profound impact on the profitability and success of both operations.
For example - Standard Cost –what does this actually entail for your company/product? Does it differ from Cost of Goods Sold? Is Standard Cost pegged to initial cost of goods sold or to current product value? Is there a difference, if so how is it accounted for? How much freight is included? What about reverse? One can begin to see the financial implications of understanding what it is finance or operations are actually talking about.
Costs
Any operations or finance manager worth their salt knows and plans for the obvious costs of doing business. Freight, labor, overhead, repair parts and collateral, etc… these are black and white costs of doing business. Although variable, they each have a distinct definition and more than likely some clear cut strategy for how to manage them. They are invoiced, easily observed and to a great degree under the control of managers and analysts alike. What many fail to consider are the hidden costs that tend to piggy back on these known costs. These hidden costs are often times camouflaged as necessary evils or passed off as “just the way it is”. The truth is these hidden costs can go undetected for long periods of time.
It is true not all aspects of businesses are controllable, but they can be accounted for their risk mitigated if not neutralized. Freight cost for example, clearly represents a dollar value, it is easily traceable to a line on the P&L, it is planned for and forecasted to, trended and constantly monitored for spikes or valleys.
When a carrier shows up late for a pickup or delivery or damages goods in transit it doesn’t change the cost of freight. Yes, a claim may be filed against the value of the damaged goods or the carrier may receive a mark down on their scorecard but who pays for that? Who covers the overtime the dock supervisor pays his or her associates and what does it cost for a clerk to file damage in transit claim, what is the opportunity cost of that product not making it to market? Many times, the answer is “well it a cost of doing business and there is no way to plan for it”. While that may be said of a great many factors in a reverse logistics operation it does not change the fact that these costs unchecked quickly corrode the already slim margins most organizations operate on.
Moving on to inventory, as an organization masters shrink and waste in its operations, effective materials requirements planning (MRP) takes center stage in controlling inventory cost. Order too much and excess and obsolete materials are the result, eventually translating to sale at a loss or a write off. Order too little, and sales are lost. So, where is the hidden cost? As your friend in finance will tell you, excess inventory hurts cash flow and increases good old fashion carrying costs. Until it is sold or disposed of, it takes up space in warehouses and may need to be inventoried and even then, it represents an unrecoverable sum of money. Shortfalls can be just as caustic to the bottom line. Until it is sold or disposed of it takes up space in warehouses, requires continued attention from inventory control functions. As inventory ages there are other concerns that represent a significant hidden cost that increases with time
HIDDEN RL FINANCIAL COSTS
Price Creep
Price Creep is the gradual and steady increase in the valuation or market price of an asset. Price creep refers to a situation in which either an individual or a group of individuals gradually lessen its reservations about paying higher prices for a given asset. As it pertains specifically to product returns, price creep can occur in many aspects of the product return life cycle including:
- Increases in transportation costs associated with the shipment of product returns.
- Cost of processing returns by a third party repair and/or refurbishing company who was subcontracted to receive, plug & play, process, repair, refurbish, re-accessorize, re-package, store and ship refurbished product returns on behalf of the manufacturer.
 Market Value
Product returns never result in a profitable situation, i.e., the cost of reclamation and subsequent intrinsic market value will never exceed the profit of the initial sale of the product. To the contrary, product returns result in losses to the manufacturer, the dealer and often the end user consumer.
From a manufacturers perspective, a return results in a lost sale, the return shipping cost (dependent on sales agreement and reason for return), the cost to plug & play, repair and/or refurbish, re-accessorizing and re-boxing, storage cost, resale of the refurbished or as-is merchandise and transportation cost of shipping the product to the ultimate purchaser.
From a dealer or retailer perspective, any return results in a lost sale, possibly a lost customer, repackaging and shipping costs associated with the return to the manufacturer and a lot of paperwork to obtain an RMA, process it through the manufacturer and obtain a credit for the returned merchandise.
From the customer or end user perspective, a return can be measured in frustration that the product purchased failed to work as expected, re-cartoning the product and returning the product to the retailer they purchased it from or via a third party authorized service center who was unable to make the repair due to the type of defect or unavailability of the appropriate service parts.
Finance managers will recognize that innovation and newer products will impact market value, sometimes causing obsolescence, and Reverse Logistics managers need to have processing speed related to market price erosion. All might agree for example, that digital cameras should be processed more quickly than appliances based on their estimated 15- 20% annual erosion rate. Finance and RL managers also have to recognize a point when scrapping the products in an environmentally responsible way will make more sense as a disposition option.
Condition Classification Of Inventory
Classification of inventory if fairly straight forward for “A” stock which is considered new, pristine product which has never been opened, sold through to a consumer or used. There is no set criteria used universally to classify inventory that does not meet the very straight forward requirements for “A” stock products. The classification for refurbished and “As Is” products will vary somewhat from one manufacturer to another. Although there is no set “B”, “C” or “As Is” stock definition used universally in the industry, there are some generally accepted guidelines that are typically utilized to classify this used inventory. It should be noted that many OEM’s and manufacturers have incorporated some type of usage mechanism into the hardware, firmware or software in recent years to enable them to detect the amount of time the product has been used, to serve a similar purpose as an odometer in an automobile. For example, many Copy machines and Printers have sheet print counters, and most television product and accessory players including recording devices have some type of internal clock or other mechanism that is capable of detecting product operational time.
Dealing with Returned Goods
Transportation, defect and policy are the three major categories used to classify reasons for product returns. These categories can be separated into more specific and detailed groups, but for the purposes of this discussion, they will be classified as sub-categories (key drivers) of product returns.
Return Classifications
- Transportation- Damaged, Concealed Damage - When damage occurs while product is in the forward logistics process it is generally considered a transportation related return. When ownership of a shipment transfers from the manufacturer to the retailer typically determines who is ultimately responsible for resolving a shipping related issue. The moment of transfer is generally defined by contract.
- Defective Products – Initial Failure and in-warranty defects - This class of returns results when an end user (dealer or consumer) discovers a defect in the functioning of the product during initial operation or while operating either on the dealer floor or at the consumer’s home. The decision to repair versus return is generally determined by corporate policy of the manufacturer who generally offers a warranty period on all new products sold through distribution. In this document we will only consider product returns that related to product defects. The definition of defect can often include perceived defects rather than actual product failures.
- Return Policy- Product sold into the market falls under specified or contractual policy between the manufacturer and the dealer. The manufacturer’s corporate policy also establishes the warranty period of products it manufactures and sells as well as the service policy as it relates to product repairs and product returns. These designations can serve to drive returns in a variety of ways.
RETURN ON ASSETS (ROA) APPROACH TO REVERSE LOGISTICS
Reverse logistics is often considered a cost center vs. a potential break-even or possible profit center. Many firms still do NOT have an EOL (end of life) or product inventory disposition exit strategy to optimize their Return on Assets (ROA). This is an untapped measure that can not only dramatically improve both operational and financial improvements.

ROA provides an operational perspective and metric to show how effectively a firm is managing their assets to generate profits. Within reverse logistics, the big item within ROA looks at the firm’s effective or not effective utilization on their product inventory.
There are many links and drivers that impact ROA including:
- Cost reductions that come through reduced COGS and operational expenses.
- Enhanced and Improved asset turnover through better inventory systems/controls and management
- Increased revenues through increased throughput of having more new items sold versus returned.
One key reason why companies fail to get its RL program to produce results is the existence of too many silos. RL touches many facets of both internal departments and external supply chains. It is common to see firms allocate costs to each department and not understanding their total system wide costs in reverse logistics. Thus, without establishing a true reverse logistics P&L and knowing all these costs, it makes it impossible to get any significant results, let alone enhance ROA.
Having the right process in place to proactively deal with returns will yield better results. Knowing your inventory polices, and properly aligning these to your specific product life cycles will help to optimize your ROA. Quick and early action is critical in the entire inventory disposition process, as “lost” time is “lost” money.
If your company has a fragmented approach, or just is unable to effectively manage or implement this RL process, then dealing with product returns may be a non-core activity. Thus, you may consider doing a RFP, and outsource some or all of your operational returns processing process steps to a third party service provider whom will enable you to achieve your desired ROA targets & enhance your bottom line.
Case Study 1: RL$ Savings from Freight Claims
A manufacturer of consumer electronics products had no standard procedures in place to ensure that all legitimate damaged in transit (DIT) freight claims were being filed in accordance with the interstate cargo act. The general rule is that a receiving or delivering carrier is liable for the actual loss or damage to a shipment upon proof by a claimant of (1) delivery to the carrier in good condition, (2) arrival at destination in damaged condition and (3) the amount of the damages. The carrier’s defenses to the claimant’s cause of action are very narrow. Basically, the carrier must first prove freedom from negligence, and then, that the loss or damage was caused by one of five specific exceptions:
- An act of God.
- An inherent nature or vice of the goods.
- An act of the shipper.
- An act of the public enemy; or
- The authority of law.
In this case, the volume of returns was substantial and subsequently, the dollar value of damaged in transit product returns was sizable.
A project was established and representatives from each cross functional touch point in the process were assigned as team members to a newly established project. The team, utilizing Six Sigma methodology, followed the standard DMAIC process to define measure, analyze, improve and control the process of filing legitimate damage in transit claims in a timely an accurate manner.
The net result of the implementation of a definitive process to properly file DIT claims in a timely and accurate manner resulted in claims reimbursement in excess of $2M US dollars annually which significantly improved the manufacturer’s bottom line profitability.
Case Study 2: RL$ Savings from Reduced Retail Returns
Philips worked with a large national retailer to implement electronic registration of the product serial number at point of purchase. At that time, like many other national retailers, there were returns by consumers in the 10-12% range. Most would go back to the manufacturer, adding costs for both companies, and high rates of “no fault found (NFF).
Both the retailer and Philips agreed many of the NFF returns were related to ease of use and the consumer experience, and Philips developed projects to make improvements in those areas. It was also known that some percentage of the returns were fraudulent. The products might have been older, from another retailer, or from a local flea market. In some cases, stolen products were going out the back or front doors and being returned for cash refunds. The retailer had no way to validate returns, as most occurred without a sales receipt, and manual attempts to validate them would slow down the register and negatively affect consumer satisfaction.
After electronic registration began, the retailer and Philips could compare the amount of returned items where the serial numbers were never captured at the register during the bar code scans. From a low of 90% capture and valid serial numbers, the 10% fraudulent volume was reduced to 1.5% over a two year period by use and enforcement of the registration program now built into every register.
CONCLUSION
The next step is to develop a best friend on “Mars or Venus”. This will require effective communication. Your discussions will demand that you listen and speak knowledgeably. Review the terminology and case studies in the article for ideas to start your dialogue. Look for a common ground by identifying a shared business vision.
If you already have a best friend, improve your communications to build teams, promote & improve an idea, product, service or process. The objective is to create value for your business. Improve the bottom line and identify margin leaks in the areas of asset management, operation expenses and labor expenses.
Enjoy the journey to your common destination – Improved business results!
Originally Published in RL Magazine 2010, Edition 26 by the Reverse Logistics Association Consumer Electronics Committee, co-authored by: Tony Sciarrotta of Reverse Logistics Association (formerly Philips Consumer Electronics); Christopher Fabian, Professional Services Solutions, LLC; Maryellen Daniels, ITRAN; Charles Dunton, ATCLE; Brian Eddy, SubCon Industries; Paul Rupnow, Andlor Logistics Systems
Updated in 2021 - Edits by Cathy Roberson, Research Manager, Reverse Logistics Association
 Reverse Logistics Association Consumer Products Committee